
Over the past year the web has been awash with opinion articles that in one way or another allude to the flow of Bitcoin in the world. The three most salient examples are the ‘Grexit’ fears during athe summer, China’s economic slowdown and ISIS use of Bitcoin. In all of these, the focus was on individuals or organizations buying Bitcoin for their own financial purposes.
Data may show that there was a lot of unjustified hype in the media about these and other cases. Therefore analyzing these flows to the extent possible, may uncover certain underlying trends. These trends might be conveying a different story to the one that is being told, so it is crucial to understand the forces underpinning them.
Bitcoin Trail Followers Beware
Aggregate Bitcoin flows are not easy to follow. A lot of analysts might make mistakes and conflate certain flows with others. In an effort to avoid these pitfalls and make sure the readers avoid them as well, it is necessary to delve into the sources first. Bitcoin inflow and outflow data available comes from the Bitcoin exchanges, which means it measures the amount of Bitcoin being bought in a given geographical location. Data about inflows and outflows relating to commerce, is more difficult to find. This is due to Bitcoin’s ‘pseudonymity’, lack of regulation and the fact that many businesses that use Bitcoin probably declare their earnings in local currency, or in most cases are not forced to disclose specifics since they are not publicly traded.
Exchange flows however do serve to tell at least a significant part of the Bitcoin trail story. It shows patterns of Bitcoin acquisition geographically, in terms of time of day and transaction volumes. In spite of the fact that buyers can resort to VPN services to hide their real IP addresses – and by extension geographic location – mapping these transactions can tell a tale of core demand for Bitcoin, as far as the location of the funds converted into Bitcoin are concerned. Maybe only clients paying with funds from a digital wallet could trick the exchanges into believing the money is coming from a different location.
An Overwhelming Majority of Honest People
As is the case with most transactions, it is safe to assume that most of the people buying Bitcoin through these exchanges have no interest in resorting to sophisticated schemes to hide their geographic location or the origin of their money. This assumption is a critical for the perspective from which an analyst may look at the story told by fiat to Bitcoin flows. This is going to be the tale of the average Bitcoin buyer around the world. This average buyer is a regular person, probably a Bitcoin enthusiast buying a few coins to try the currency out or buying in to make a modest profit.
Data Flows
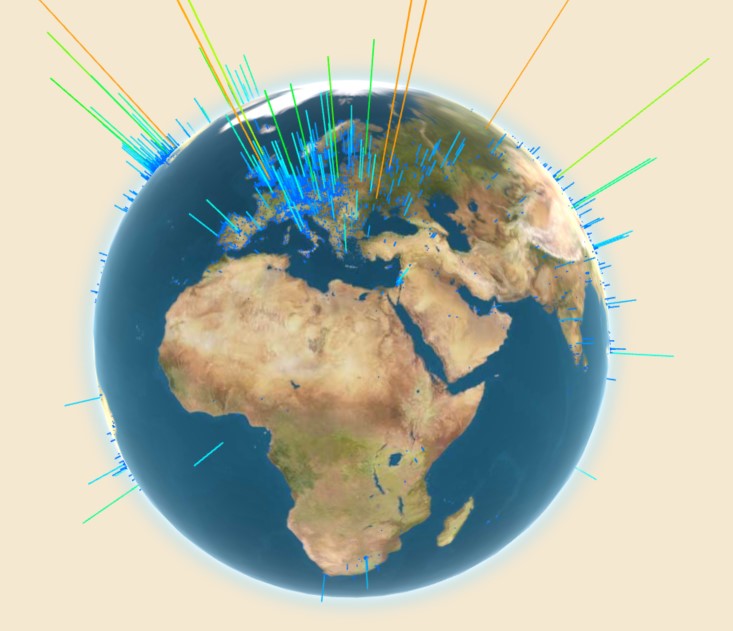
Data collected from 2 main sources – fiatleak.com and bitcoinglobe.com – show many relatively small transactions being made through the exchanges, as well as the geographic concentration of Bitcoin. Small transactions that rarely exceed 2 Bitcoins, should be consistent with the behavior of the average person trying Bitcoin out or putting a small amount of money into the currency for a small expected profit. The sites also show the cumulative flow of these small purchases over a period of time.
It is important to point out that the maps are toggled on to track activity from selected Bitcoin exchanges 24 hours a day. As such it is important to understand the flow of data relative to the time of the day at which it takes place in a given location. To understand if flows to a given country are spiking, it is necessary to observe the maps for long periods of time and cross reference the data between them. It is also necessary to compare the data with historic flows, and since the Bitcoin economy still doesn’t have appropriate analysis tools set up, it is extremely difficult to have a good enough degree of accuracy. Despite this fact, the data collected may dispel a few myths about Bitcoin flows and give the public more clarity about what is really happening with the cryptocurrency.
Three Cases: China, Greece and ISIS
Fiatleak maps show substantially larger inflows of Bitcoin into China, at least on a cumulative basis. At a glance, this fits the whole story about Chinese capital flight looking for Bitcoin as the economy heads for lower growth. In fact, the price of Bitcoin did increase dramatically a month or so ago exactly at the same time that the world was getting ‘lackluster’ data from China. This is where analysts have to dig a little deeper to debunk misperceptions. A thoughtful look at the map below will serve to uncover the caveats behind these assumptions:
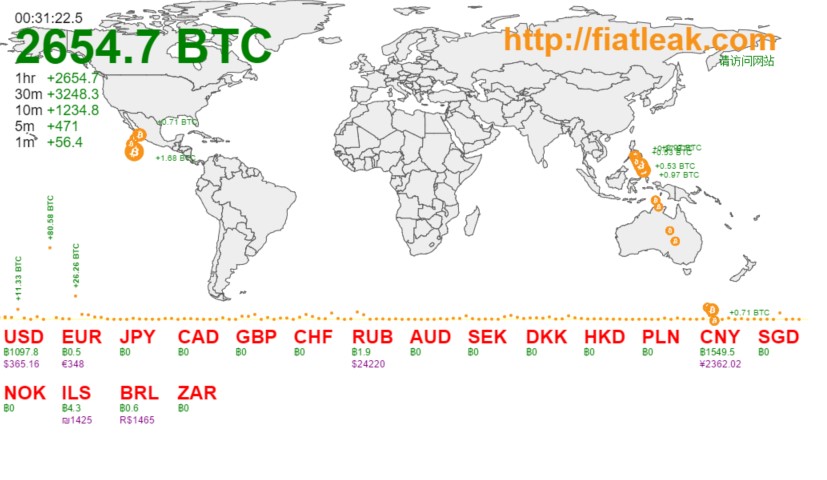
On the map it is evident that the Chinese market has bought 3 coins for every 2 coins bought in the US. If we look at these flows as a function of time, it is possible to see that these purchases are being made between 17:00 and 18:00 Shanghai time, mainly when people are finishing their work days. The US is still asleep at this time of day. The local time in NYC when the data was collected was between 04:00 and 05:00; in San Francisco it was between 01:00 and 02:00. It is safe to assume that there would be more economic activity in the hours just after the work day is over than in the middle of the night or just before the average person wakes up to go to work.
There is also data that the map would not show but is widely known nonetheless. China has a population that is anywhere between 3.5 and 4 times as big as that of the US. The Chinese economy is about 2/3 as big as the US economy. This means that on a per capita basis, China’s economy should be around 5 times smaller than that of the US.
There are also other non-numeric factors that must be taken into consideration to paint a more complete picture regarding these Bitcoin flows into China. The main factors are regulation, and access to capital markets and foreign currency. The Chinese government restricts its citizen’s access to the markets much more than the US does. Additionally, the CFTC declared that Bitcoin will be regulated as a commodity for trading purposes. China has thus far refrained from any kind of clear Bitcoin regulation.
This means that Chinese could be more likely to buy Bitcoin in order to protect their assets from devaluation than Americans, especially since they have less investment alternatives than their US counterparts. On the other hand they have less value to transfer into Bitcoin as a whole. It may also seem that China buys more Bitcoin than the US, but there are more people in China than there are in the US.
Trends are therefore not as clear cut as they may seem. These trends also seem to intensify when comparing China to the behavior of the Bitcoin buyer within the EU. During the same period of observation, EU citizens bought a meager 0.5BTC. Most were probably at work, which may help explain lower flows, but still the ratio to what their peers in the US and China bought is extremely low. If Bitcoin users in the US were buying at a rate of 2:3 as compared to their peers in China while they were sleeping, then EU users should have been buying Bitcoin at a higher rate as they were starting their working day, if the groups displayed similar behavior.
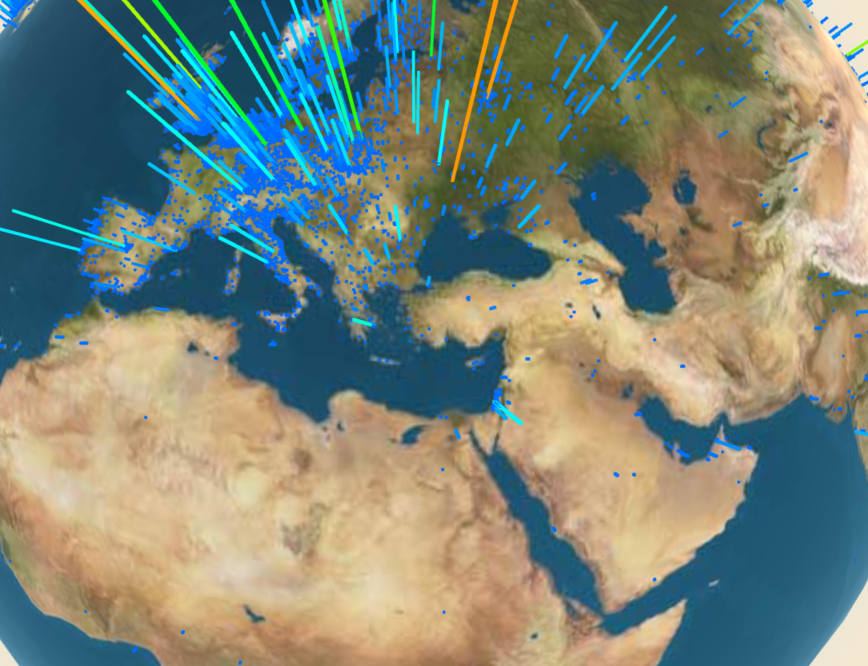
The legal framework for buying Bitcoin in the EU is much clearer than in China, following the ECJ ruling that these transactions would carry no VAT since Bitcoin is a currency. Furthermore, the Euro zone economies are still struggling and the Euro is weakening at a record pace. Those are strong incentives for people to look for a currency which will allow them to hedge those risks. But the trends in Europe and in the Eurozone in particular may be much more complex. Additionally, there is no historic data on these maps to recollect what the trends looked like at the top of the Greek default panic about 5 or 6 months ago. The current geographic concentration of Bitcoin might help build a better picture of Bitcoin flows into Europe:
It is clear that Bitcoin concentration in Greece is lower than in many other European countries, but this is also due to its relative size within the Euro zone and the low GDP relative to its European peers. Since these maps lack precise numbers, the analysis is based on the visual characterization of the data, and perhaps the visuals compel the analyst to compare Greece to other non-European neighbors like Turkey.
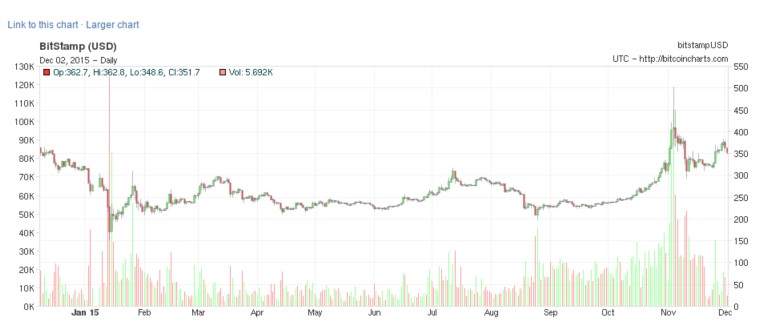
There is no indication as to when these coins got to these places, but if they indeed present an accurate picture of Bitcoin concentration, there is no reason to believe that Greek economic woes would generate a Bitcoin price spike. Historic price data for Bitcoin corroborates this assumption. Bitcoin might have gone up just slightly during the Greek default panic a few months ago. A Bitcoin price graph with which the data from this maps can be cross referenced to a certain degree, clearly shows that Bitcoin had modest gains during the Greek crisis, and sharper ones when disappointing data from China started to build up. These assertions follow the assumption that mining or commerce have marginal influence on the price of Bitcoin:
By looking at the more detailed map on Greece, it is possible to see how the hype around the influence of Grexit or disappointing data from China on Bitcoin, dwarfs in comparison to the hype following headlines that highlighted ISIS use of Bitcoin. The visuals on the maps provided by Bitcoinglobe and Fiatleak show relatively high concentrations of Bitcoin in China and Greece, along with a high volume of Bitcoin purchases in China. They also show the lack of activity in and around Syria and Iraq, where the heart of the ISIS terrorist organization is located:
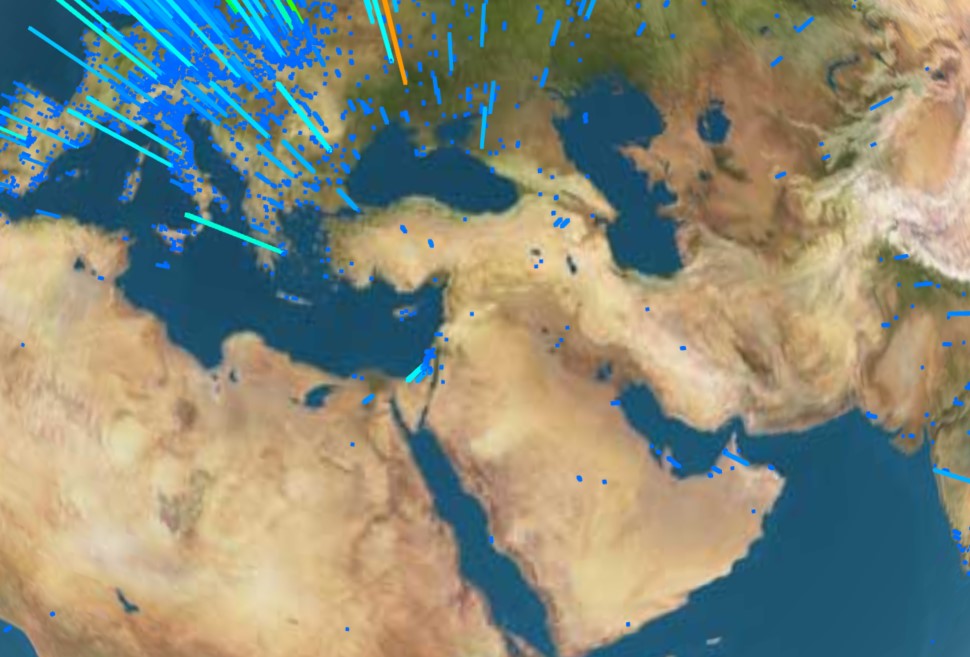
In the case of ISIS, the information has to be analyzed in the opposite direction. There are virtually no Bitcoin acquisitions in ISIS held territory and coin concentration around it is quite low. The reason might be that ISIS is more prone to deal in oil and other assets, and might not be buying Bitcoin at all. Instead ISIS could be pooling some limited computing capacity together in order to mine Bitcoin. The small amount of coins they hold might also be in European addresses perhaps, since it is safe to assume that a terrorist organization would want to hide its financial activity as much as it can.
Final Thoughts
It is difficult to follow the Bitcoin trail. The most useful information about Bitcoin flows comes from Bitcoin exchanges around the world. Data about Bitcoin purchases paints a partial picture and requires more in depth analysis. Moreover, mainstream media does not necessarily report on the stories that these trails show with the required rigor. Instead a lot of misleading information has been compiled by analyzing the data in a superficial manner. Looking at these Bitcoin flow maps, it is clear that one of the most important stories remains untold. That story will be the focus of next week’s article.


