A Closer Look At Declining Bitcoin Transaction Volume
When mainstream media outlets and some pundits start talking about price and its correlation with Bitcoin transaction volume, take every word with a pinch of salt

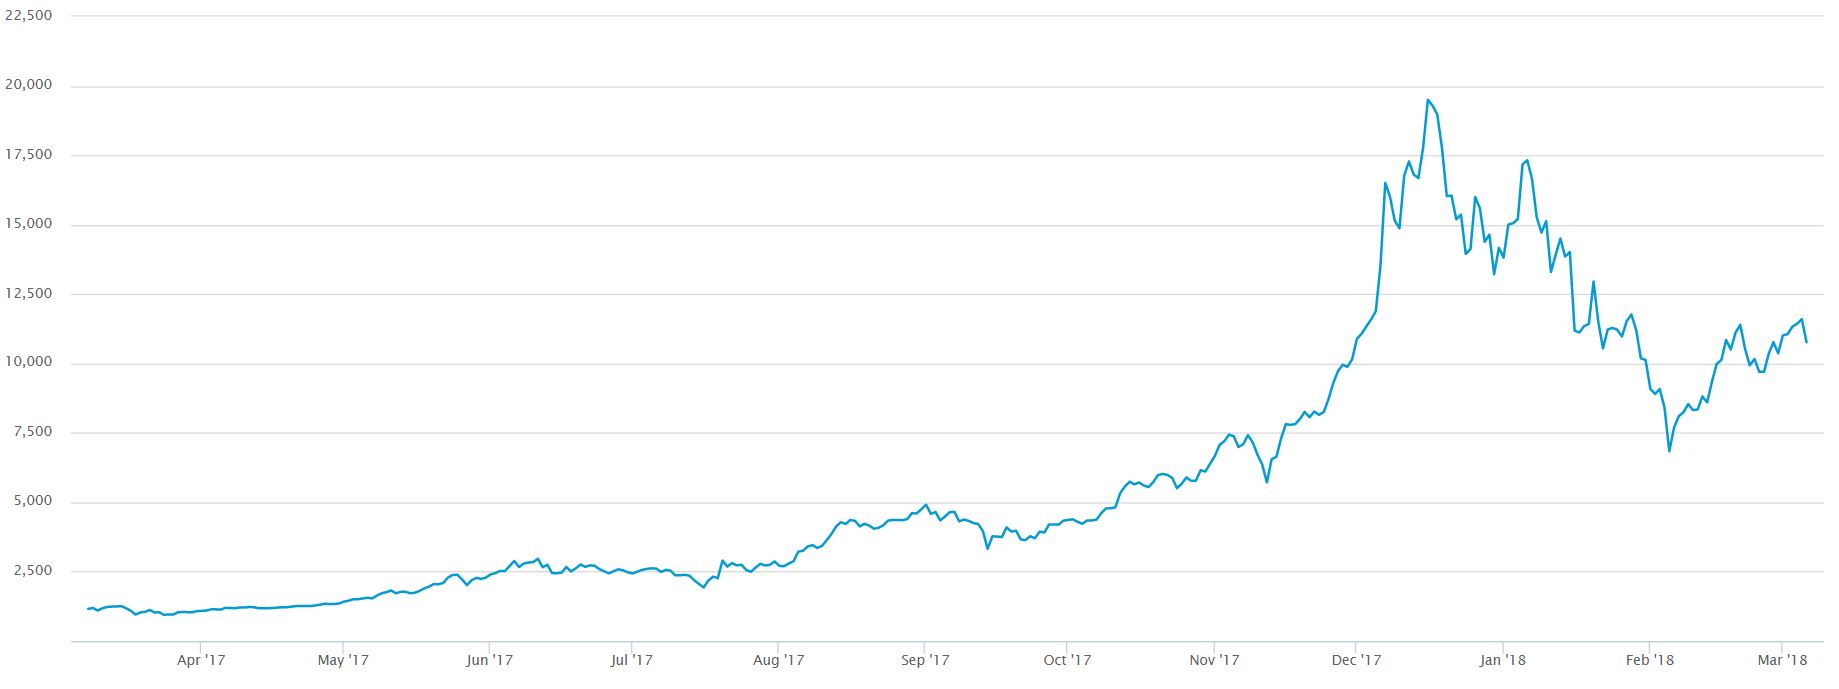
Bitcoin has taken a well-documented tumble since December 20, 2017. That day the most well-known cryptocurrency broke the $20,000 USD mark on several exchanges. That rise was reflecting badly upon the pundits that were publicly speaking against Bitcoin. Some critics joined the chorus saying that Bitcoin transaction volumes were already beyond the network’s capacity, and that the mempool bottleneck would have an effect of the price of the coin sooner or later. As transaction fees rose with the number of transactions stuck waiting for confirmation, prices began to slide on December 22nd. They have struggled to regain lost ground since.
Prices Stabilizing
Bitcoin prices have stabilized since they hit a low of around $6,000 USD earlier this year. BTC is now moving largely within the $9,500 USD to $11,500 USD range over the past few days. A recovery that would take it closer to that $20,000 USD mark is proving to be a challenge. Transaction fees on the other hand, have gone down significantly, falling even below the $1 USD threshold at points. A mild price recovery, relative stability and transaction prices falling 15 times below their peaks doesn’t add up. Lower Bitcoin transaction volume seems to explain the lower fees, but at first sight it is at odds with stabilizing prices and a swing back towards positive territory for Bitcoin prices.
Why is There a Decline in Bitcoin Transaction Volume?
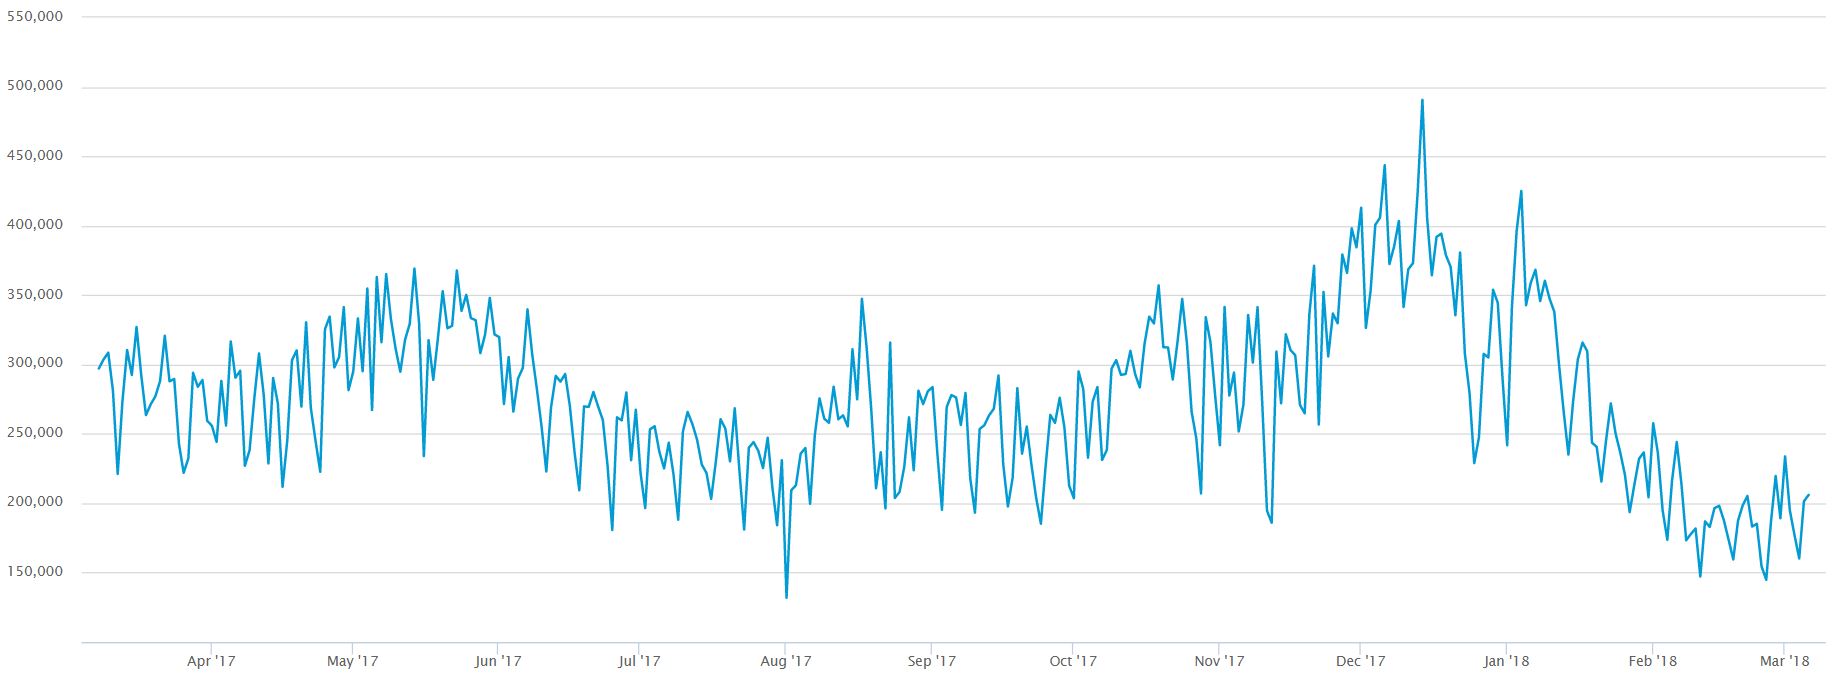
Bitcoin has had some of the lowest number of transactions confirmed per day since March 2016. This makes mainstream media outlets and pundits believe that interest in Bitcoin is also declining. Lower Google search volumes for Bitcoin and cryptocurrency related subjects is also declining, reinforcing the idea that the public is just not into BTC anymore.

When it comes to Bitcoin transaction volume, an increase will not always be a good thing, just as a decrease is not necessarily bad either. These transaction volume swings have happened before, and their correlation to the price is not always there. In this case, it seems Bitcoin transaction volume is down due to a change in user behavior, not necessarily a loss of interest.
SegWit Aside
Some might say that a decline in Bitcoin transaction volumes is due to the implementation of SegWit. Although SegWit could help with congestion in the network, it was mainly launched to deal with malleability. In any case, SegWit has not been adopted by the whole network – although adoption rates have risen lately. This rules out SegWit as a cause and forces analysts to focus on a much less known phenomenon called batching.
Transaction Batching
The process of batching brings large bitcoin transactions together into a single bundle. As a result, there will be additional free space on the blocks to include other transactions. Looking at BTC price charts of, it is possible to see that despite failing to reach previous all-time highs, Bitcoin is still about 60-80% higher than it was at its lowest point this year. At this point there are also less transactions than a year ago when Bitcoin was worth about 10% of what it is worth now.

The numbers don’t lie, and they picture they show contradicts what mainstream media and some pundits want the public to believe. Looking at 3 distinct points on the price and Bitcoin transaction volume charts will help dismantle misconceptions and strengthen the argument for transaction batching:
- A year ago, Bitcoin price was at $1,157 USD. At the same point in time, Bitcoin transaction volume was 303,632 transactions.
- When Bitcoin was closing in on its all-time high, it hit peak transaction volume over the last year, with a total of 490,644 transactions and a price of $16,679 USD.
- Now, Bitcoin transaction volume is at 206,016 transactions and the price is hovering around the $10,000 USD mark.
When Price Peaks, Bitcoin Transaction Volume Doesn’t Necessarily Follow
When Bitcoin was close to its peak, network congestion increases and results in growing transaction fees. Once Bitcoin prices reached an all-time high, transaction volume declined. But as prices bottomed out at around $6,000 USD just over a month ago, Bitcoin transaction volume was even a bit higher than it is today, with around 216,000 transactions processed when prices hit their lowest levels this year. This not only supports the idea that transaction batching is taking place, but it also questions the kind of conventional wisdom that mainstream media outlets and some pundits would like to convey.
Bitcoin transaction volume and the price of the cryptocurrency don’t necessarily correlate; in fact, they might move opposite to each other which makes sense. When prices are high and climbing, there will be people that are reluctant to sell, which is precisely what allows the bids to go even higher. Some might even be more afraid of how a drop in Google searches can impact prices negatively, and that might even be more relevant than Bitcoin transaction volume when talking about price, but even that might be a stretch.


